KINEXON Sports App Guide: Phase Index Widget
The Phase Index Widget is a powerful new feature in the KINEXON Sports App that provides coaches with deep insights into training drills. By displaying the normative range of key performance metrics for different drill types, it helps coaches understand typical versus high-end workload demands, compare phases across single sessions (POST) and historical data (DEVELOP), and design training sessions that optimize player development while preventing overtraining.
Why Use the Phase Index Widget?
Key Benefits for Coaches
- Plan Efficiently – Build data-informed practice scripts with the right workload balance.
- Compare Demands – See how different drills compare in workload and intensity.
- Track Progress – Identify trends over time to adjust training strategies.
- Filter & Customize – In DEVELOP, set a minimum phase duration to refine your analysis.
- Export Data Easily – Save individual tables or export global data for deeper review.
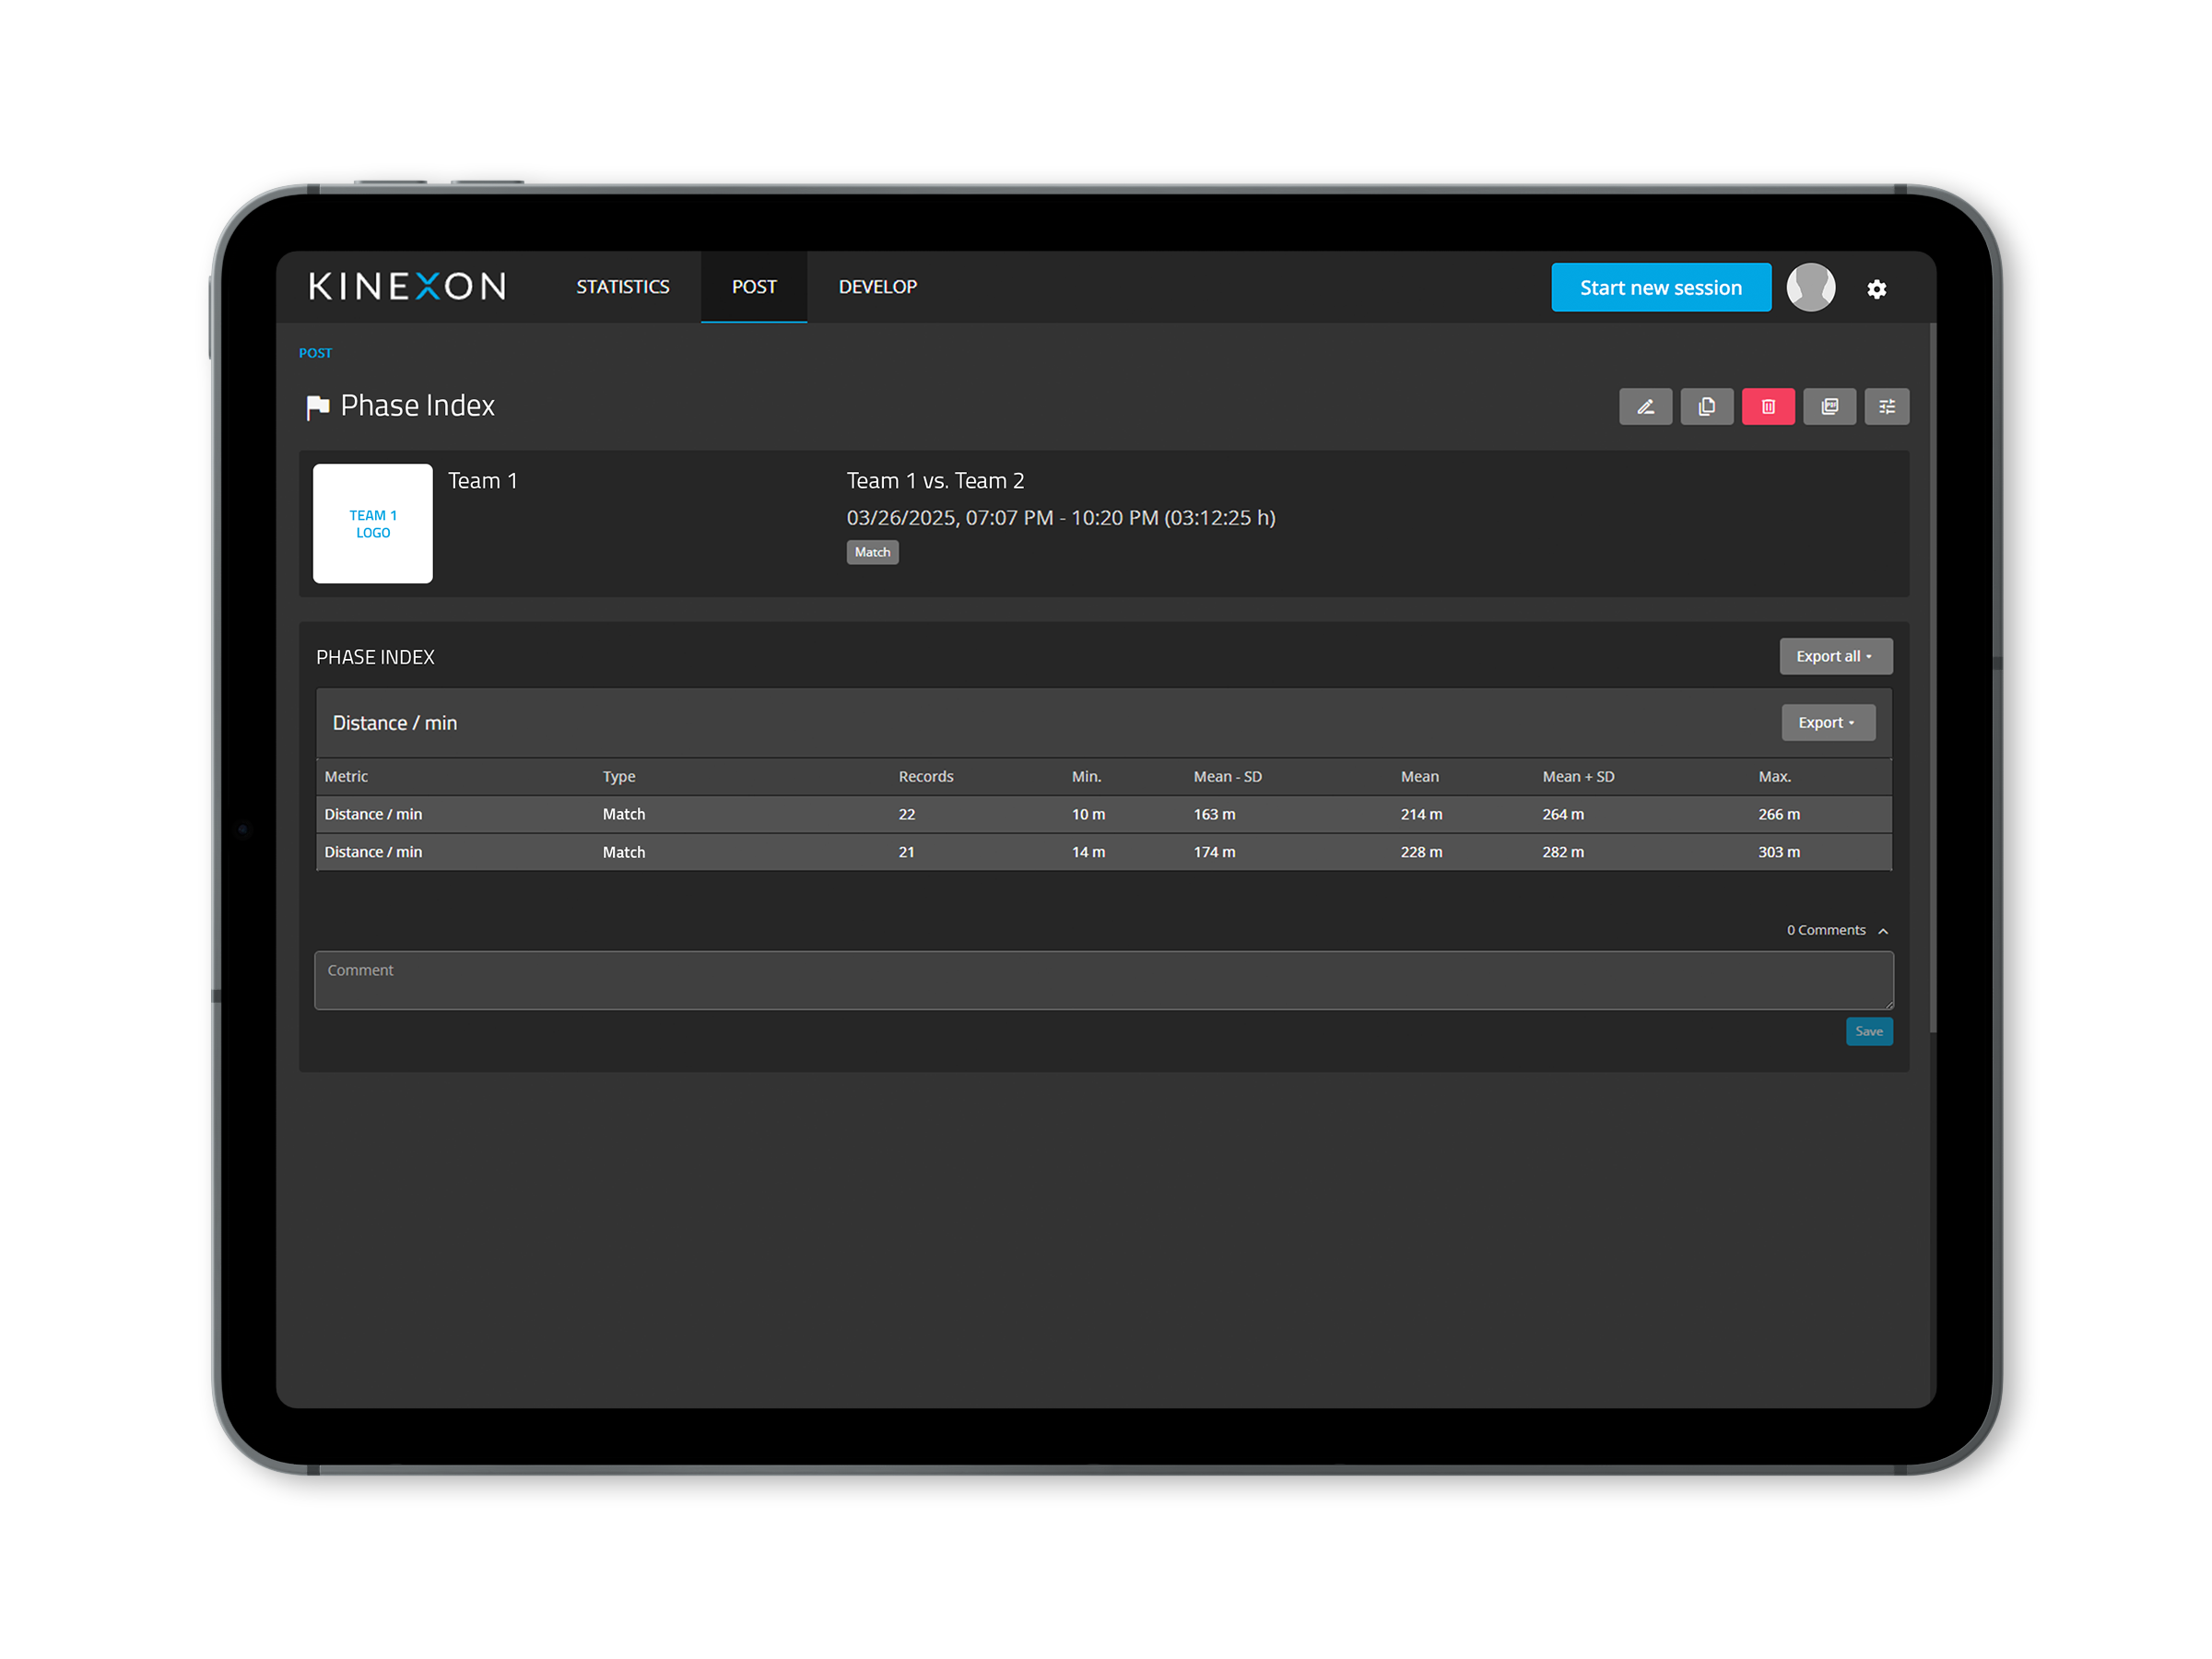
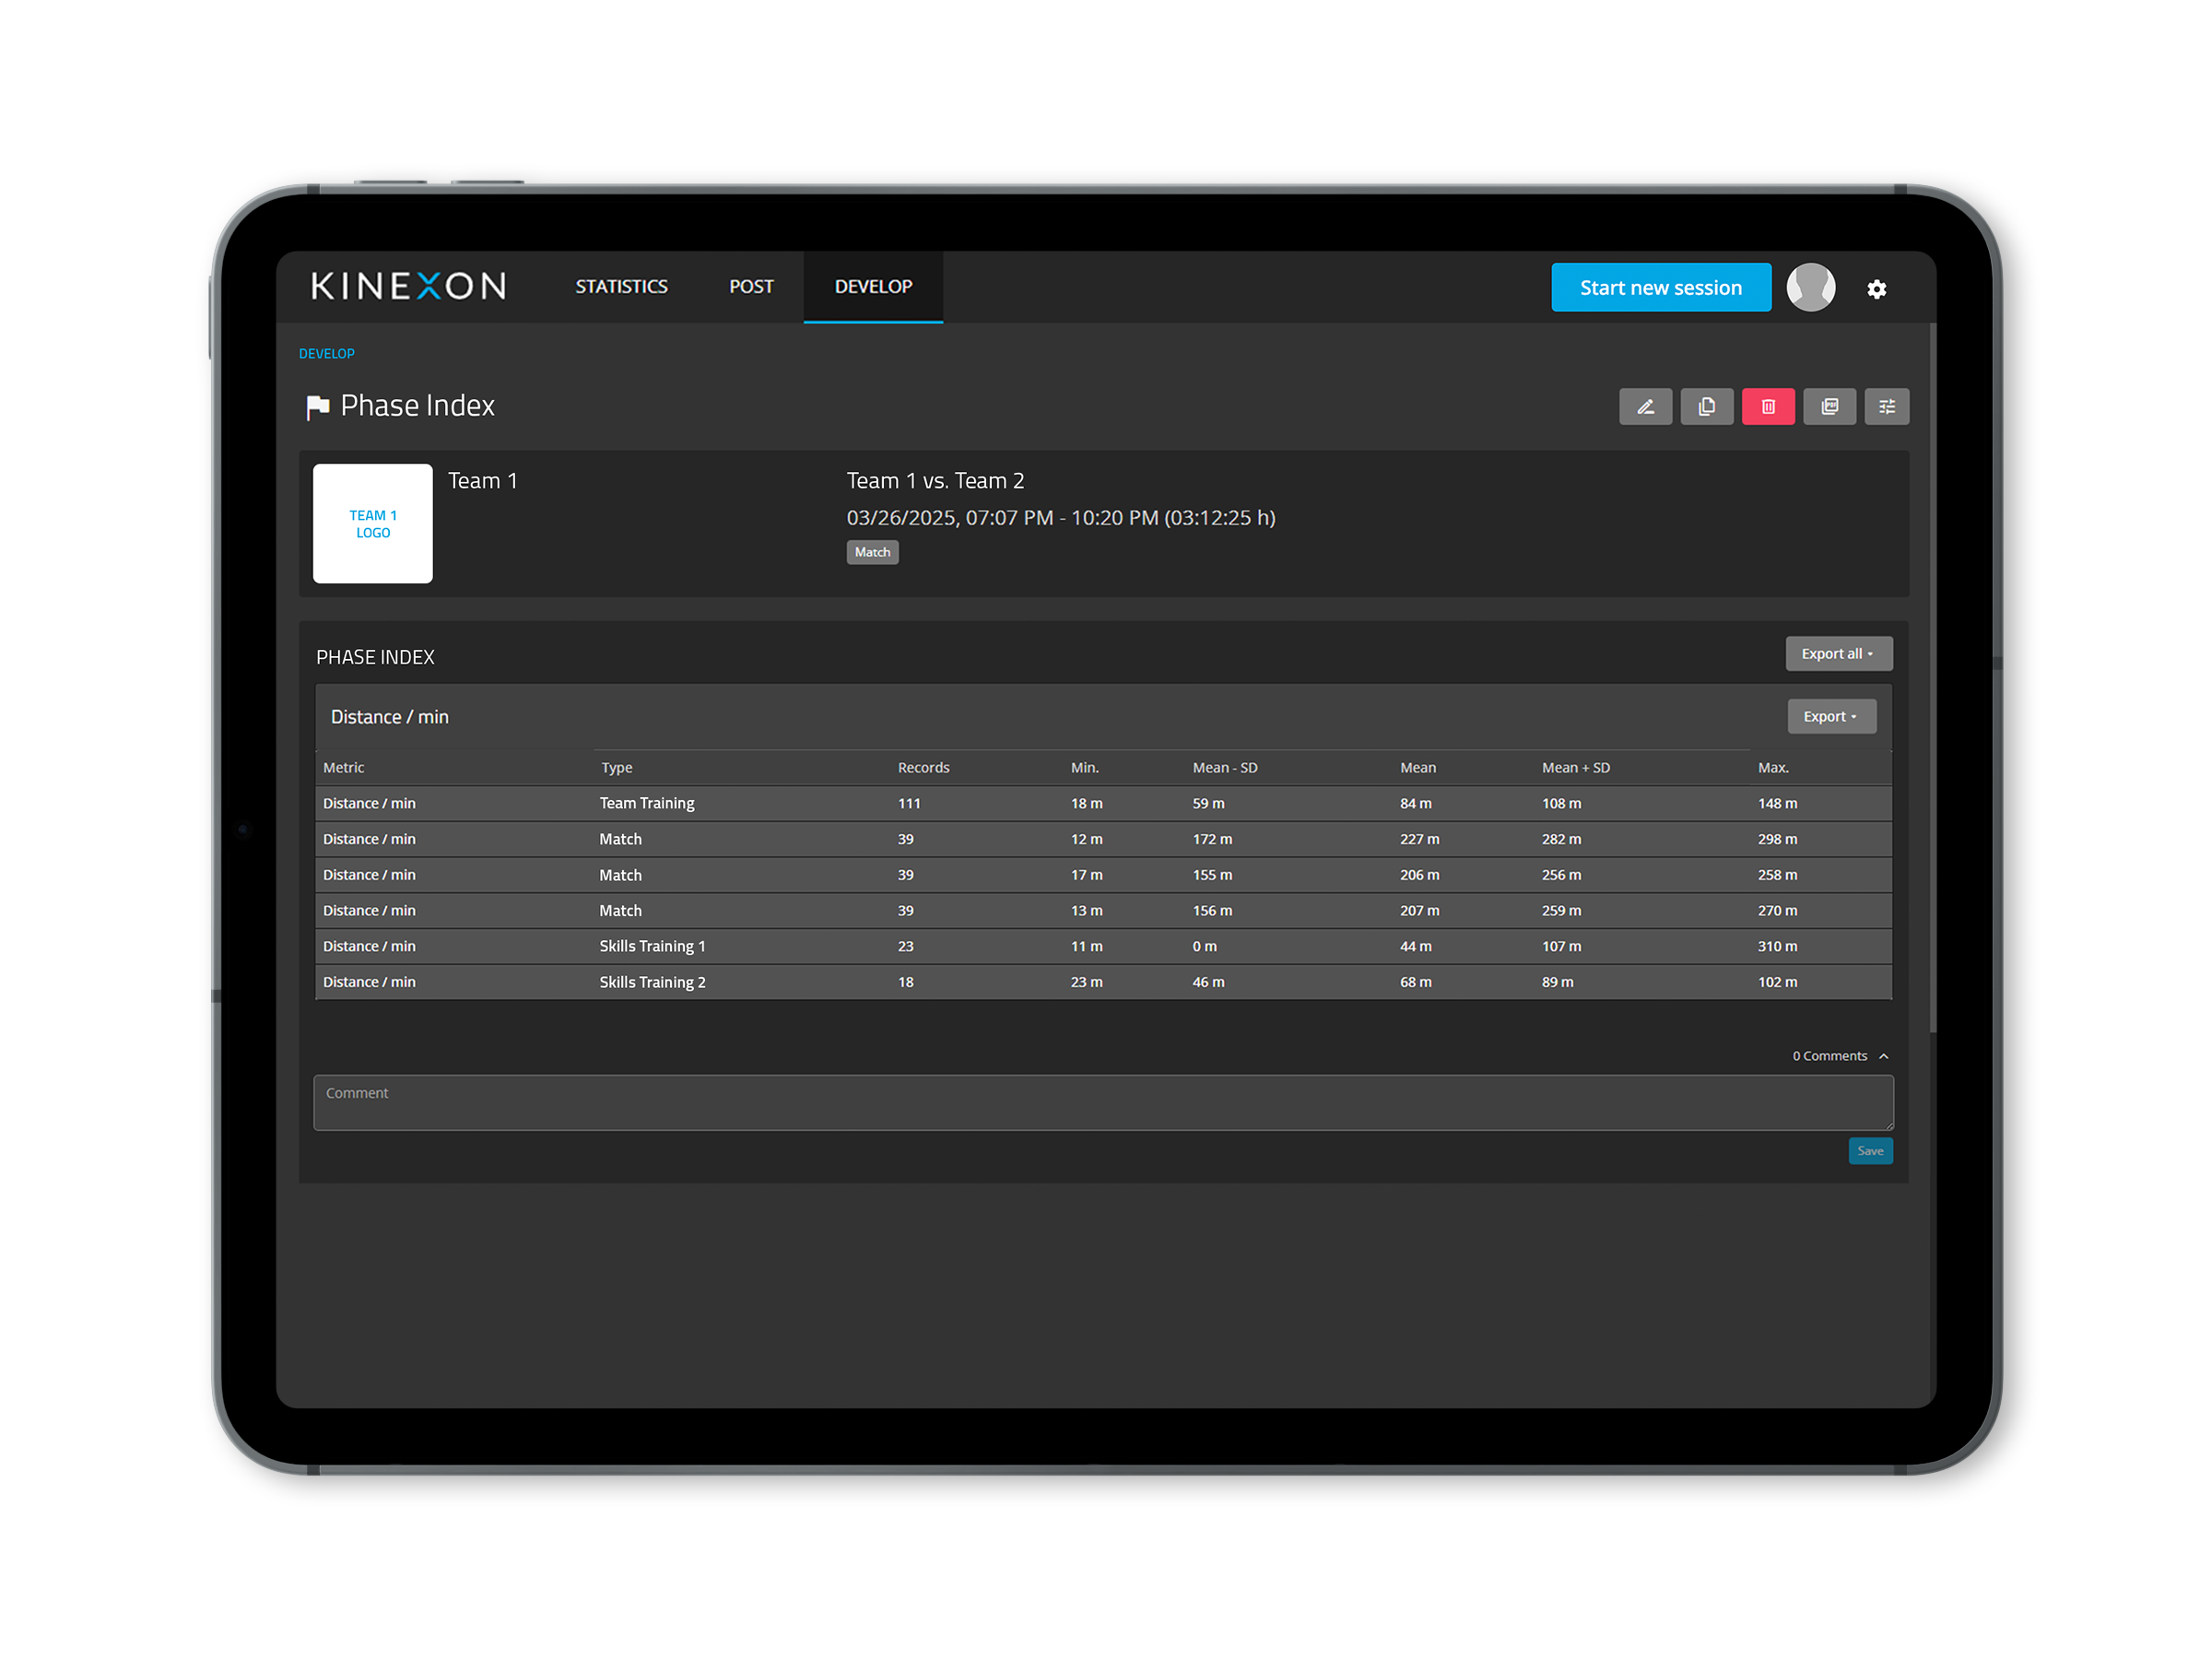
Understanding the Widget Layout
The Phase Index Widget is a table-based visualization that categorizes training phases and displays:
- Phase Type – What type of drill it is (e.g., Warm-up, Sprint, Small-Sided Game).
- Metrics Normative Range – The typical and high-end values for selected performance metrics.
- Record Count – The sample size (Example: If a Warm-up drill had 20 players, the record value is 20. If two Warm-up phases occurred with 20 players each, the record is 40).
Example views:
POST Widget (Single Session Analysis) – Breakdown of drills within a session.
DEVELOP Widget (Long-Term Analysis) – Same logic, but includes a minimum phase duration filter.
How to Use the Phase Index Widget
Step 1: Ensure Phase Types Are Defined
- Assign phase types to all training drills in KINEXON Sports App.
- Use phase types to represent specific drills rather than generic groupings:
- Bad Example – Phase Type: Drill, Phase Description: 3 on 2
- Good Example – Phase Type: 3 on 2, Phase Description: Day after game vs. opponent A.
- Increased granularity of phase types will result in more specific insights from the Drill Index.
Step 2: Open the Phase Index Widget
- Navigate to POST (single session) or DEVELOP (historical data).
- Select the Phase Index Widget from the widget options.
Step 3: Customize Widget Options (For DEVELOP Analysis)
- Set Minimum Phase Duration – Exclude short phases that are not representative of typical demands for that drill.
- Export Data – Save individual drill tables or all global data.
Step 4: Interpret Data & Adjust Training
- Identify Overloads: If a high-intensity drill exceeds benchmarks, reduce workload.
- Compare Drills: Find the most effective drills for your players’ goals.
- Refine Training Plans: Adjust workloads for optimal player performance.
Real-World Use Case
Scenario: Optimizing Small-Sided Games for Match Readiness
Objective: A soccer coach wants players to experience game-like workloads during training.
- Step 1: Check past Small-Sided Game drills in the Phase Index Widget.
- Step 2: Compare sprint distance per player to high-intensity game norms.
- Step 3: If training values are lower, increase drill duration or intensity.
- Step 4: Monitor in DEVELOP to track improvement over time.
Want More Coaching Insights?
Read our latest blog on data-informed coaching in 2025
The Phase Index Widget is your secret weapon for making training data-informed, efficient, and impactful. Whether analyzing a single session in POST or tracking long-term trends in DEVELOP, this feature provides actionable insights to optimize player readiness and fine-tune training strategies.
Try it now and level up your coaching!
More stories

How Stanford Volleyball Uses Micro-Dose Training to Stay Match-Ready
Managing the demands of the volleyball season while keeping athletes healthy and ready to perform is a chess match for coaches. Tyler Friedrich, the Marie and Alex Shipman Associate Athletics Director of Applied Performance at Stanford University, has refined this approach for the Cardinal women’s volleyball program. His philosophy: train hard enough to stay resilient, but smart enough to remain fresh.

Building a Culture of Data-Driven Performance at Benfica
In elite sport, the goal is not just to measure, but to measure with purpose. At Benfica, performance monitoring begins with a question. What do we want to know? What outcome are we trying to influence? Data collection, then, is a means to an end: informed decision-making that improves the physical readiness, longevity, and consistency of athletes across multiple disciplines.

Unlocking a New Era in Sports Performance: What’s Ahead from KINEXON Sports in 2025
In elite team sports, performance is often decided by the smallest details – how efficiently an athlete sprints, how they handle fatigue, and how well a team manages training loads throughout the season. Coaches and performance staff need more than just numbers – they need meaningful insights, in real time, to make the right calls when it matters.

Revolutionizing Youth Football: Red Bull Wings Cup Meets KINEXON Sports
What if youth football wasn’t just about the score — but about the players who shape the game? That’s the bold vision behind Wings Cup 2025, hosted by RB Leipzig, and why KINEXON Sports proudly partnered with this first-of-its-kind event. From April 22 – 24, 2025, the tournament became the world’s first global youth football competition to feature live player and ball tracking — marking a new era in data-driven player development.

Optimizing Offseason Training: How the Ragin’ Cajuns Prep for the Football Season
The Ragin’ Cajuns football performance staff enters the heart of the offseason following spring camp, facing player performance and conditioning challenges common to other American Football programs nationwide. Their approach: optimized practice schedules designed to help players reach performance goals, backed by data.
Trust, Autonomy, and the Art of Performance Management in the WNBA
In the high-performance landscape of professional basketball, the pursuit of championships is a given. Yet, true impact often stems from a deeper purpose — one that prioritizes sustained athlete development, both physically and mentally. This perspective underscores a broader definition of success: positively influencing performance on a day-to-day basis, beyond wins and losses.

From Court to Code: The Analytics Behind Athletic Success
In the high-stakes world of competitive basketball, small margins make the difference between winning and losing. This is where optimization becomes the cornerstone of athletic performance. The focus is not just on finding a magic formula, but on creating the conditions for athletes to consistently operate at their best.

Increasing Shooting Efficiency With Data-Informed Insights
As basketball training evolves, teams are embracing data-informed insights to augment shooting efficiency. With every shot carrying potential season-changing weight in competition, refining practice intensity and replicating in-game pressure are key to gaining a competitive edge.

Maximizing Performance During March Madness: Key Strategies & Load Metrics for Coaches
March Madness is one of the most intense and physically demanding periods in collegiate basketball. The congested schedule, high-pressure stakes, and minimal time for recovery require an evidence-based approach to reach and maintain peak performance while mitigating injury risk throughout the tournament.

Optimizing Performance and Reducing Injuries in Professional Basketball
The landscape of professional basketball is evolving rapidly, with teams placing a greater emphasis on performance optimization and injury prevention. In a highly competitive environment like the EuroLeague, where the ultimate goal is to win games and championships, maintaining peak player performance while minimizing injuries is a fundamental challenge.
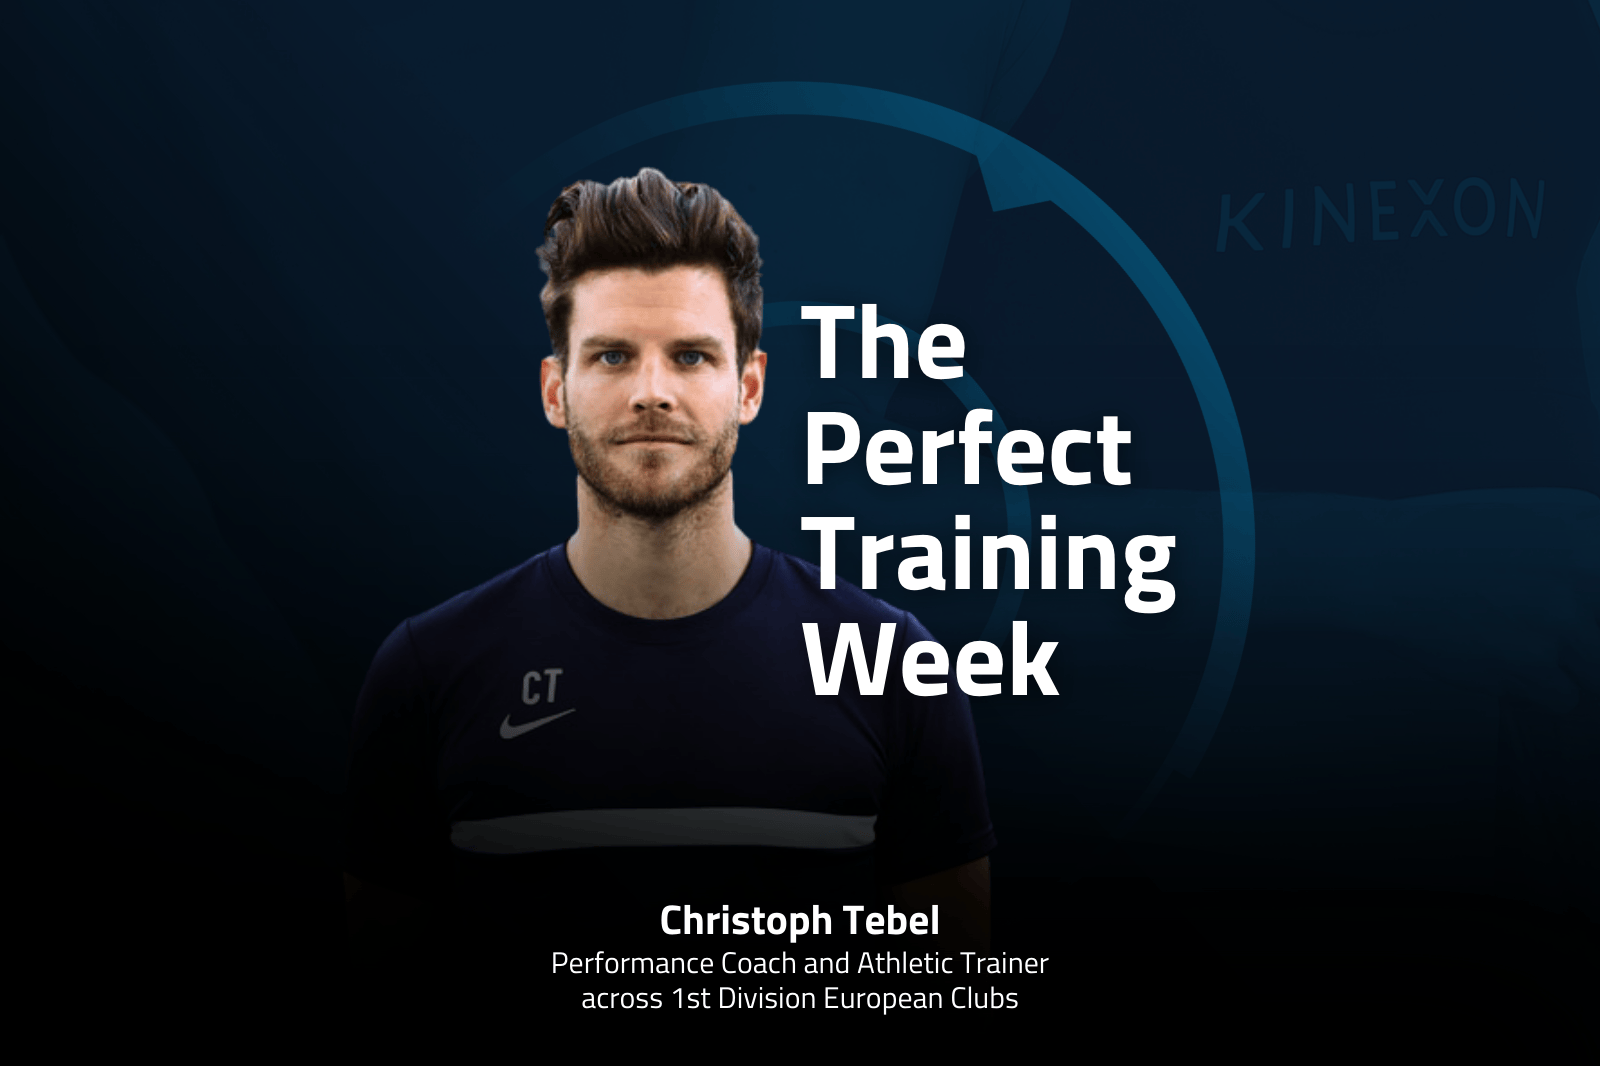
The Perfect Training Week: How KINEXON Sports Supports Smarter Coaching Decisions
Every coach knows the feeling – standing on the sidelines before a game, confident that the team is fully prepared. The training week went well, the players were engaged, and everything felt right. And when the final whistle confirms the win, the inevitable question arises:
What made this week so effective? How can we replicate it?
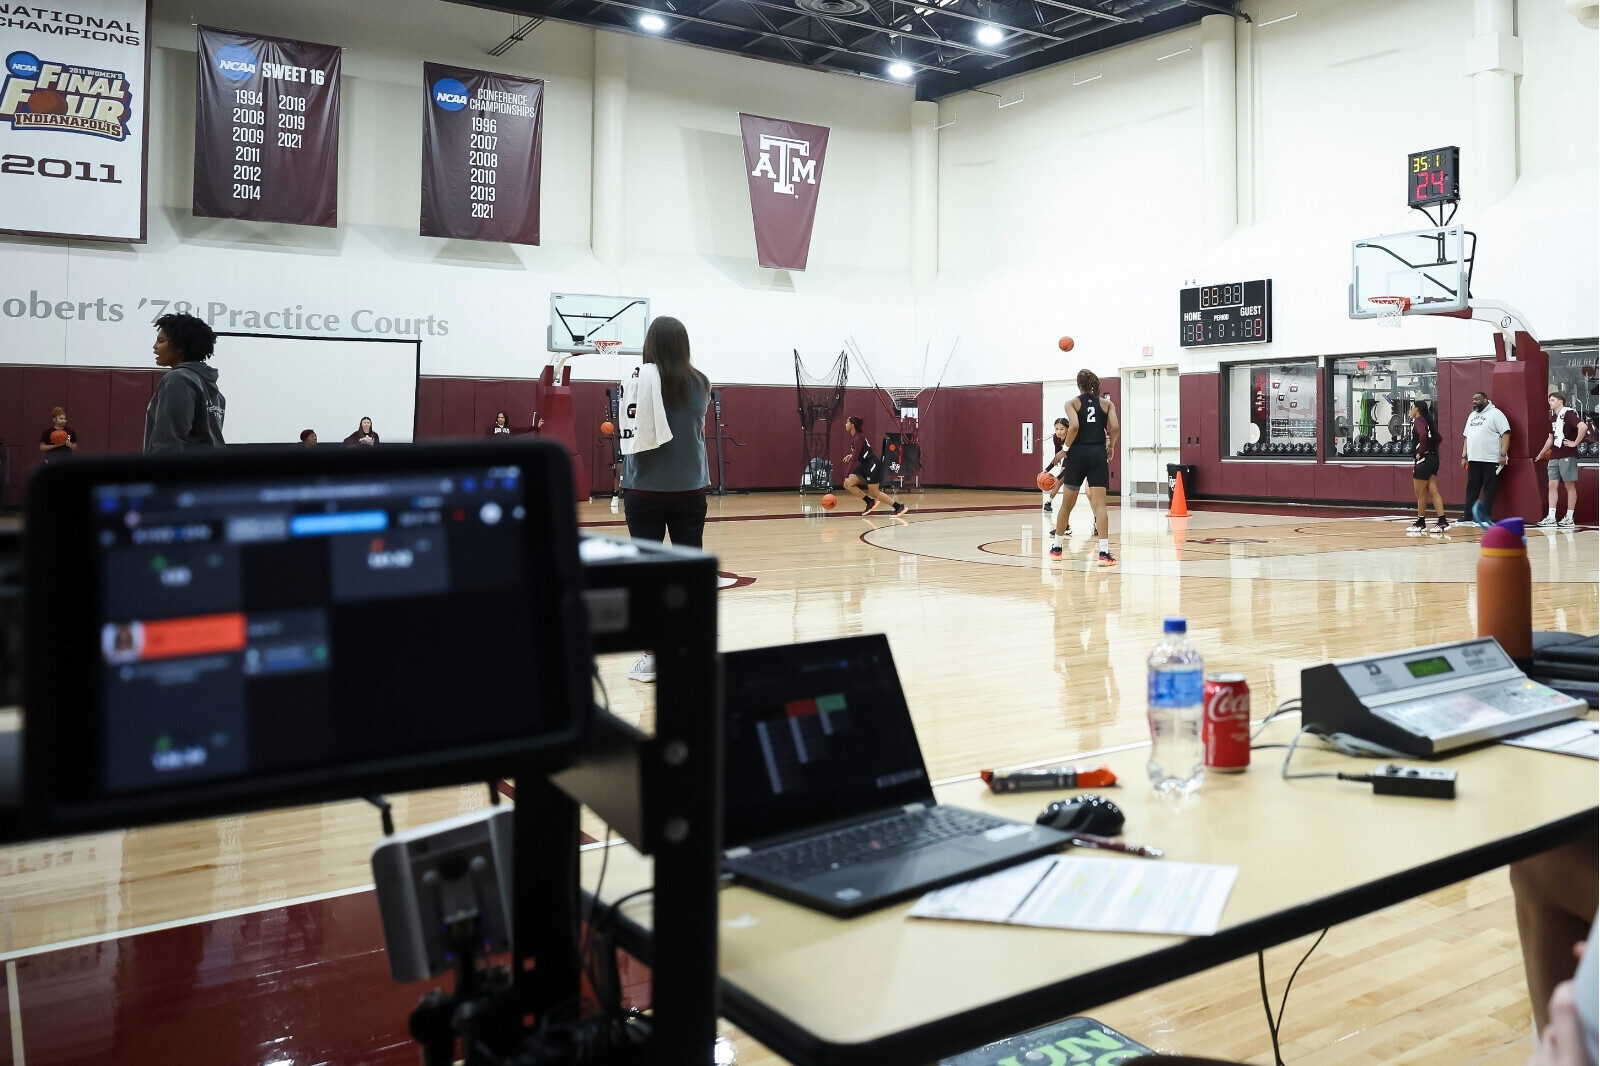
How Texas A&M Women’s Basketball Used Data to Prevent Knee Injuries
Knee injuries are a major concern in women’s basketball, with ACL injuries accounting for a significant portion of these issues. Managing player workload is key to injury prevention, but achieving the right balance between training and recovery is challenging. The Texas A&M Women’s Basketball team faced this dilemma and turned to a data-driven approach to optimize player health and performance.
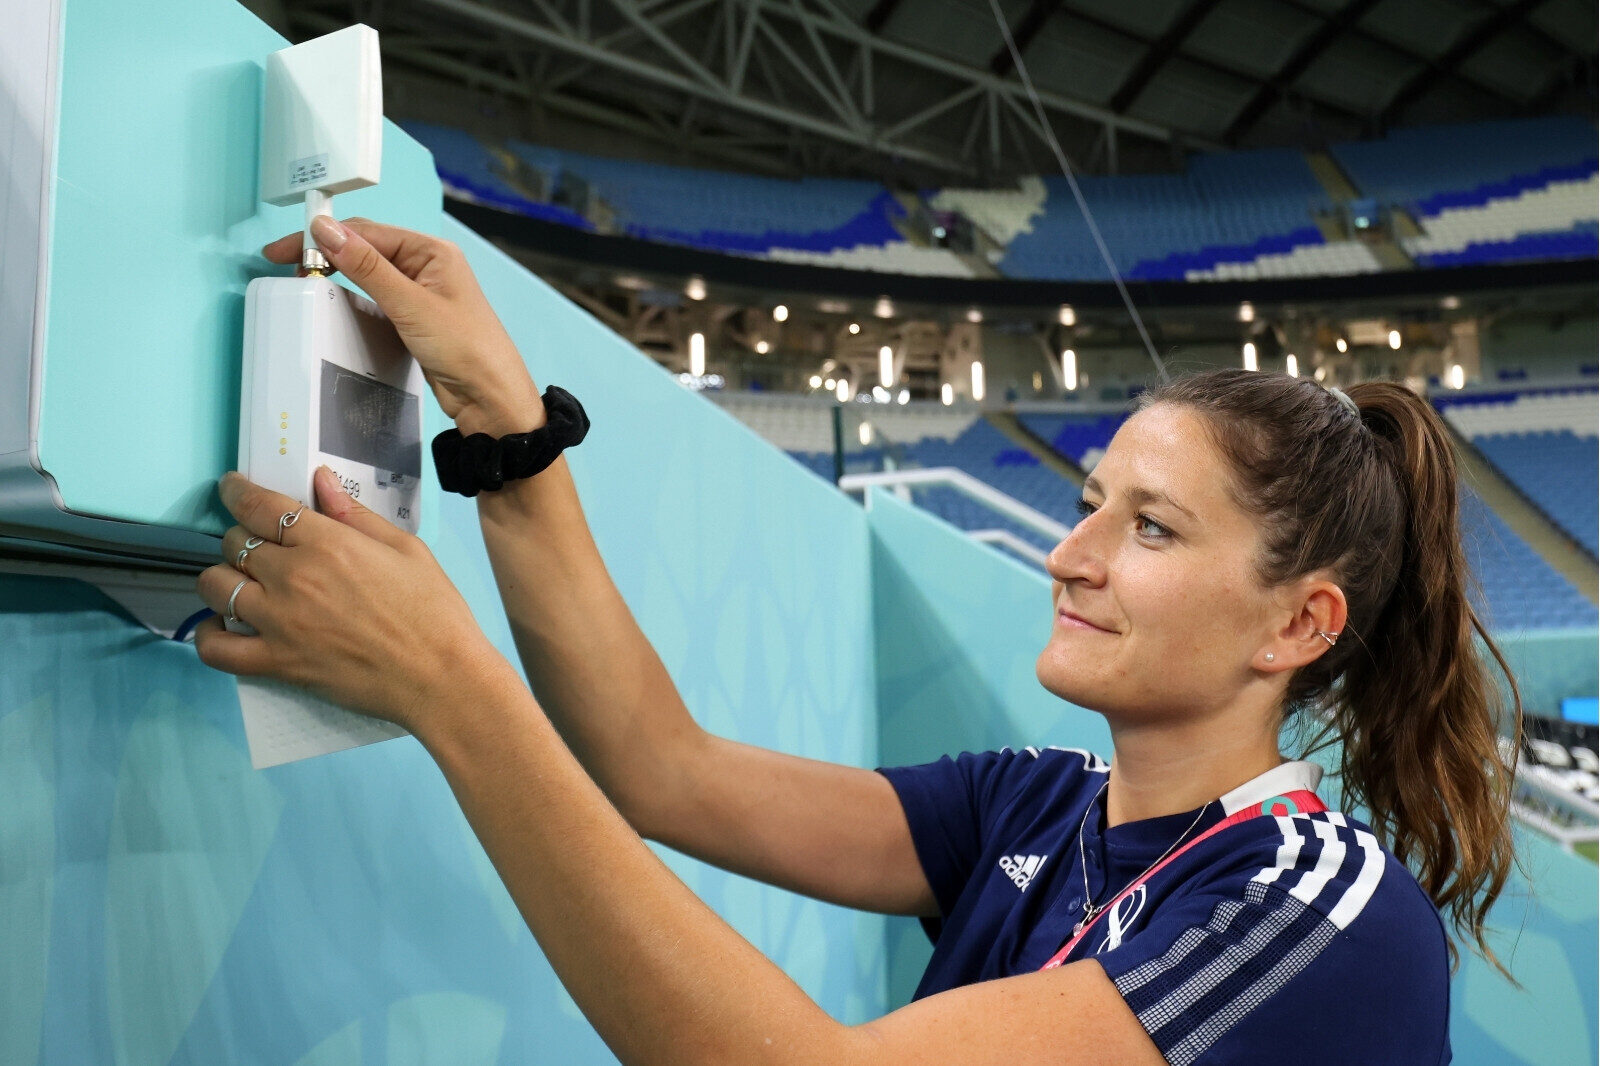
KINEXON Tracking Technologies Earn Top Marks in FIFA EPTS Performance Tests
When it comes to tracking technology in sports, precision is everything. And once again, KINEXON has proven why it’s a leader in the field. Our cutting-edge KINEXON PERFORM GPS Elite, GPS Pro, and LPS tracking systems recently underwent FIFA’s 2024 Electronic Performance and Tracking System (EPTS) performance tests — and the results were nothing short of outstanding.

Transforming Sports in 2025: Insights from KINEXON Sports for Coaches, Fans, and Referees
As sports technology evolves, 2025 promises to be a landmark year with KINEXON Sports at the forefront. Renowned for its innovations in real-time tracking and analytics, KINEXON Sports is revolutionizing the way athletes, coaches, fans, and referees experience the game.
From delivering game-changing insights to enhancing fan engagement and officiating precision, here’s what to expect from KINEXON Sports in 2025.

How Jump Count Analytics Drive Arizona State Volleyball’s Training and Match Success
Adjusting practice schedules is a fine line for coaches to walk to maximize player performance. Arizona State’s Jake Garrity, the Assistant Head Coach of Sports Performance/Sports Science for women’s volleyball, focuses on live jump count performance analytics to lay the foundation for when the coaching staff adjusts practice intensity.