How to Measure Sports Performance: Volume vs. Intensity
Author: René Prüßner
Sports analysts create and analyze metrics related to sports, which represent various aspects of athletic performance, including speed, strength, endurance, and skill. However, not all metrics are equal.

Some player metrics may be more reliable, useful, or informative than others, depending on what we are trying to measure and why. In this blog, we’ll compare volume metrics to intensity metrics to see which one fits your goals better.
What Are Volume and Intensity?
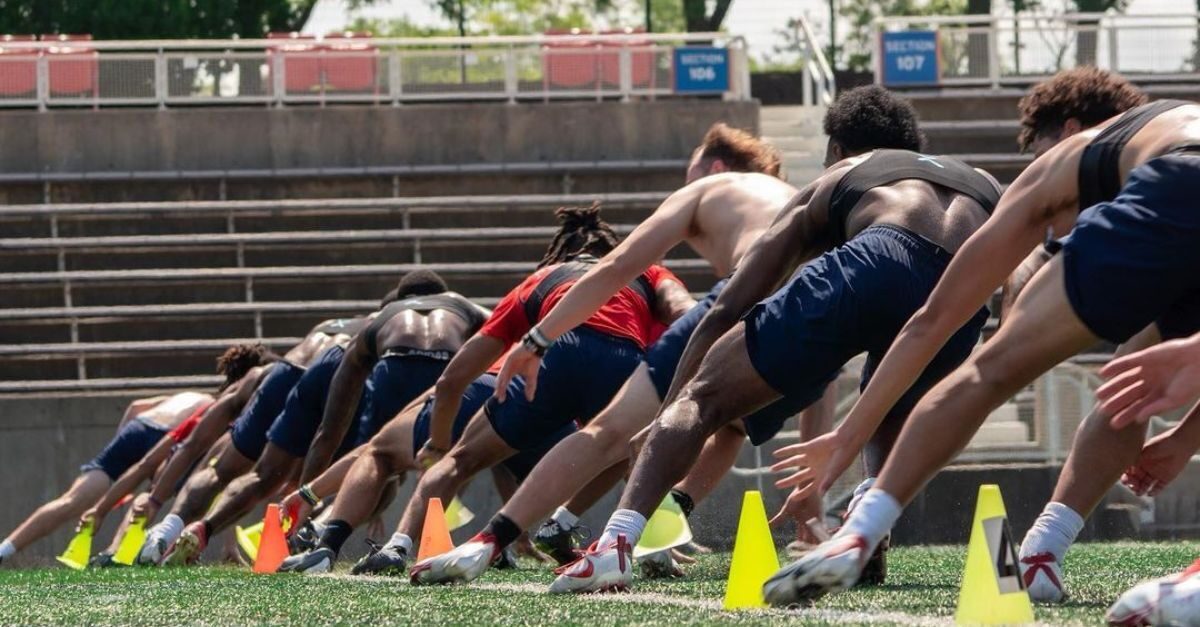
In sports performance, volume-based metrics capture the amount or duration of physical activity. They are usually easier to measure and compare, but they can be misleading or incomplete. For instance, a player who covers the most distance doesn’t contribute more to success than a player with less.
Additionally, without understanding the intensity level it is difficult to put everything into context. For example, a player can run 10km (about 6.21 mi) in 90 minutes of play vs. 10km in 45 minutes of training.
Intensity-based metrics, on the other hand, capture the pace or effort of physical activity. They are usually more reflective of the quality and impact of physical activity, but they can be harder to measure and interpret.
For instance, a player who has a high shooting percentage or a high plus-minus rating may not necessarily be more skilled or valuable than a player who faces tougher opponents or plays in different situations.
Learn about load management for football by downloading our free guide.
Pinpointing the Player Metrics You Need
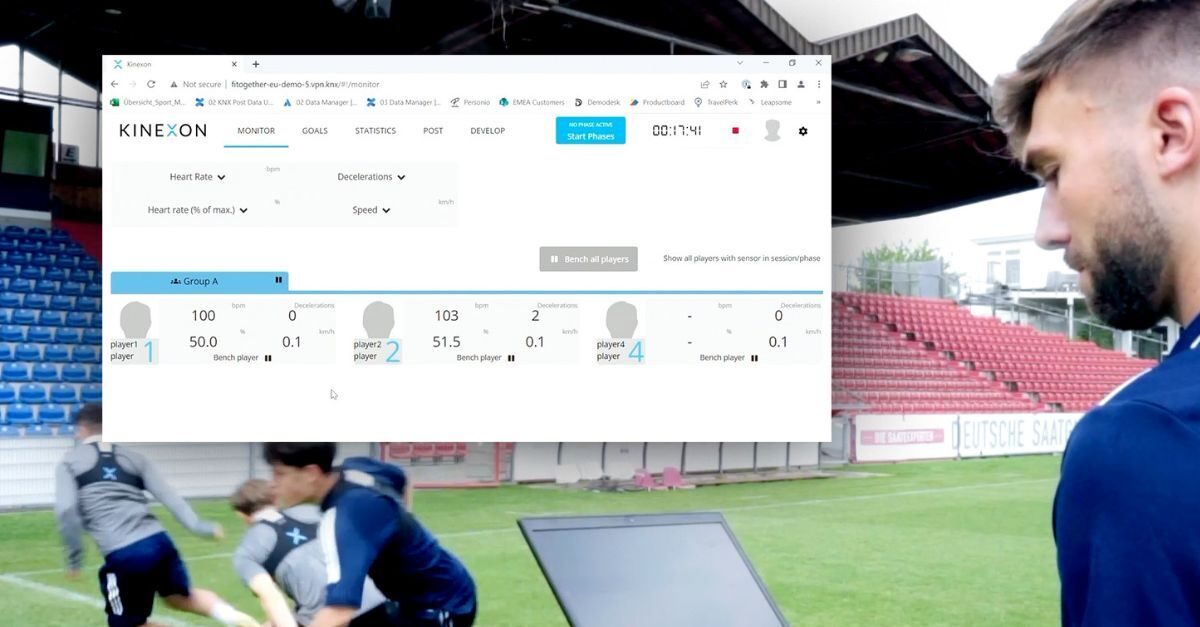
Although there are hundreds of metrics to choose from, you can pinpoint the intensity and volume metrics that mean most to you and your team. Here are some examples: Different Key Performance Indicators to Consider for Intensity:
- Distance covered in high-speed zones
- Number of sprints
- Number of high accelerations / decelerations
- Acceleration load
KPIs to Consider for Volume-Based Metrics
- Distance covered
- Duration of a session
- Time in speed zones
- Physio load
A good approach is to use both sets of metrics in combination, as they complement each other and provide a more comprehensive picture of the volume and intensity of the activity.
Why Combine Volume and Intensity?
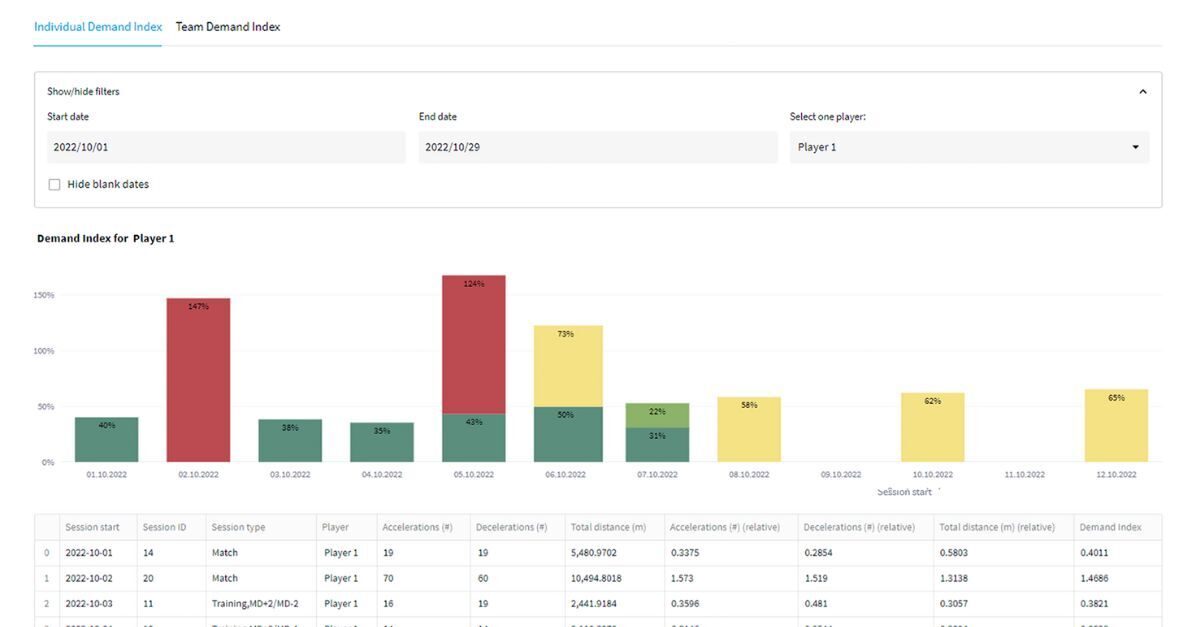
Getting an accurate look is a good start. You’ll also need to consider the context and the purpose of the analysis. By using a combination of volume and intensity metrics, you can answer questions such as:
- How much activity did the athlete perform over a given time?
- How hard did the athlete work over a certain period?
- How did the athlete distribute their effort over a selected amount of time?
These questions can help you understand the activity profile of your athletes and how it affects their health, well-being, and performance. By using sports analytics, you can measure and optimize your athletes’ activity and help them achieve their goals.
KINEXON Sports Science Consulting Helps
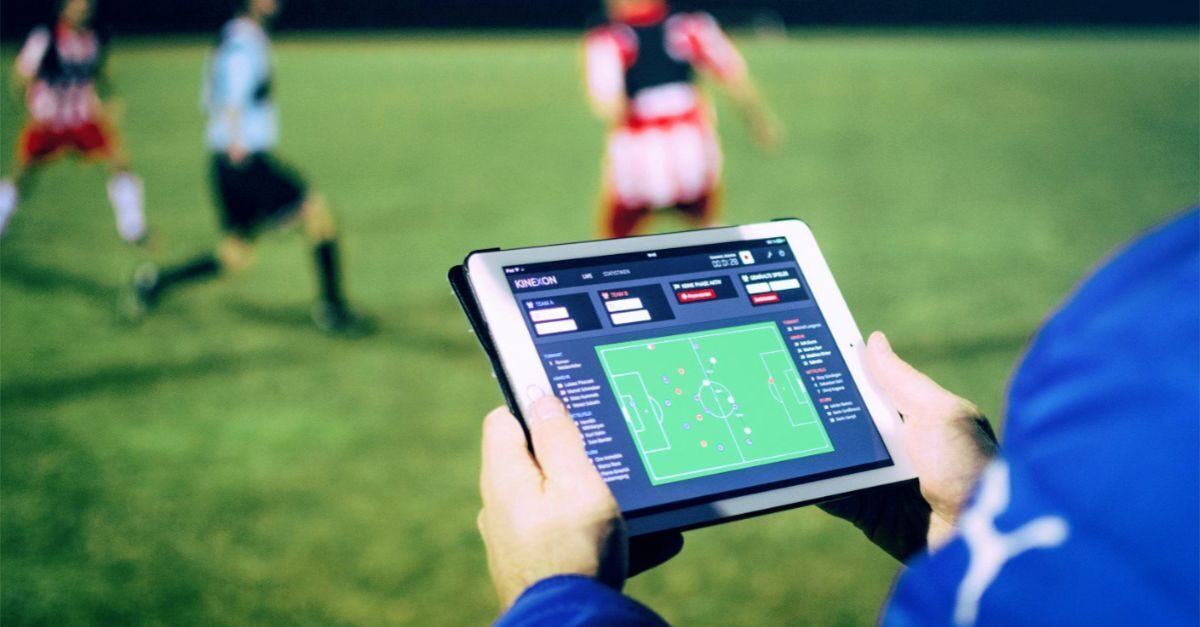
At the end of the day, you must find a good combination of both metrics to get the most out of your training and to plan accordingly for the next training session. That’s what our Sports Science Consulting team can help you with.
Our team can help you select and interpret metrics. They can be applied to any sport.
If you’d like to learn more about how volume and intensity metrics can help your team, contact us at any time.
You can also check out our guide to creating custom metrics dashboards for any sport via the link below. And be sure to check out our demand planner guide designed specifically for women’s sports.
More stories

How Position-Specific Volleyball Benchmarks Turn Performance Data into a Season-Long Plan
Position-specific performance benchmarks help volleyball coaches prepare athletes for competition and sustain performance throughout the season. With key performance metrics guiding insights for every athlete, coaches can gauge preseason progress, balance in-season volume and intensity, and support informed daily training decisions.

How Basketball Performance Data Connects the Court and Weight Room
What happens on the court shapes what athletes need in the weight room. Purdue’s Jason Kabo shares how he cross-references KINEXON performance data with sprint testing and other measures to adjust training, manage individual workloads, and guide daily decisions.

From Jump Count to a More Complete View of Volleyball Load
Jump count is one of the most familiar metrics in volleyball, but it only captures part of an athlete’s physical performance. Looking at movement intensity, like acceleration or changes of direction, and position-specific demands can provide the context needed for a more complete view of the overall load.

Limited Camps, High Demands: Preparing for International Handball Tournaments
The Women’s EHF EURO and Men’s World Championship present a similar challenge for performance staff: preparing players for an intense tournament with limited time together. How can national teams use the camps leading into competition to better understand and manage individual load?

How Drill Intensity Shapes Weekly Basketball Load Targets
Basketball coaches need more than a list of practice drills. Historical performance data and drill intensity help coaches refine practice plans, manage individual workloads and adjust the next session based on what athletes actually completed.

Sustainability: Can the Athlete Maintain Intensity Throughout the Duration of the Game?
Matching game workloads are only part of athlete preparation. Can players sustain high-intensity efforts when fatigue builds? Read more from Dayannara Munoz, KINEXON Sports Customer Success Manager, about how performance data helps coaches assess changes in output, compare practice with competition, and prepare athletes to meet the demands of the entire game.

How Individualized Football Performance Data Improves Load Management
Football performance data helps coaches move beyond team averages to individualize load management. By combining GPS metrics with each athlete’s role, historical data, and readiness, coaches can identify the right exposure, reduce excessive stress, guide recovery, and better prepare every player for game day.

Beyond the National Team Window: How the DHB Connects Performance Data
National teams spend only a fraction of the season with their athletes. See how the German Handball Federation connects club and national-team data to maintain performance context across the season and support individual decisions when players move between environments.

One Athlete, Two Jerseys: Connecting Athlete Monitoring Between Club and Country
When athletes move between club and country, their performance history moves with them. The 2026 FIBA Women’s Basketball World Cup highlights why monitoring continuity matters when athletes arrive with different workloads, competition exposure and preparation behind them.

The Role of Connected Ball Technology in Modern Officiating
From ghost goals to offsides, officiating technology has steadily raised fairness in football. But the one element at the center of every decision, the ball, has until now been silent. Connected Ball Technology (CBT) changes that, giving football’s most iconic object its own voice.

COMPETE Vision on a New Level: Refined for Faster Insights
The latest COMPETE Vision update streamlines the entire performance analysis workflow, from camera setup to automated reporting. Faster uploads, improved player identification, automated court calibration, and smarter player assignment help coaches spend less time managing technology and more time turning objective data into coaching decisions.

How KINEXON Game Insights Gives Basketball Coaches the Tactical Advantage
Basketball coaches already use in-game tracking data to evaluate their athlete’s physical exposure. As more teams adopt performance tracking methodologies, that same underlying data source can extend beyond physical optimization and be utilized to compare rosters, assess opponents, and understand the demands behind each matchup.

From Data to Decisions: Six Key Takeaways from Elite Handball Performance Practitioners
Elite handball is one of the most physically demanding team sports in the world. Within sixty minutes, players sprint, decelerate, jump, throw, change direction, absorb contact, and repeat those actions under fatigue, all while making split-second tactical decisions.

From Potential to Performance: How AI, Ball & Player Tracking Are Transforming Talent Identification in Youth Football
How can AI, player and ball tracking, and expert scouting work together to identify football talent? Discover how Skillers Academy, SAP, and KINEXON Sports combine connected technologies and human expertise to create a more objective and accessible approach to youth talent identification.

How Xavier Women’s Basketball Optimizes Daily Load Targets for Low- and High-Minute Players
Optimizing daily workloads goes beyond keeping players fresh. For Xavier’s Gil Weinstein, Head Strength and Conditioning Coach, daily (and weekly) performance reports helped connect practice loads to game demands, guide workload adjustments, and support 99% player availability throughout the 2025 – 26 season.