What Are The Top 3 Player Metrics Every Coach Needs to Track?
Author: Phil Lienemann
Selecting the appropriate metrics to describe and visualize the demands of training and competition can be a challenge. With countless metrics to choose from, it can be a daunting task for coaches that are using technology for the first time — until now.
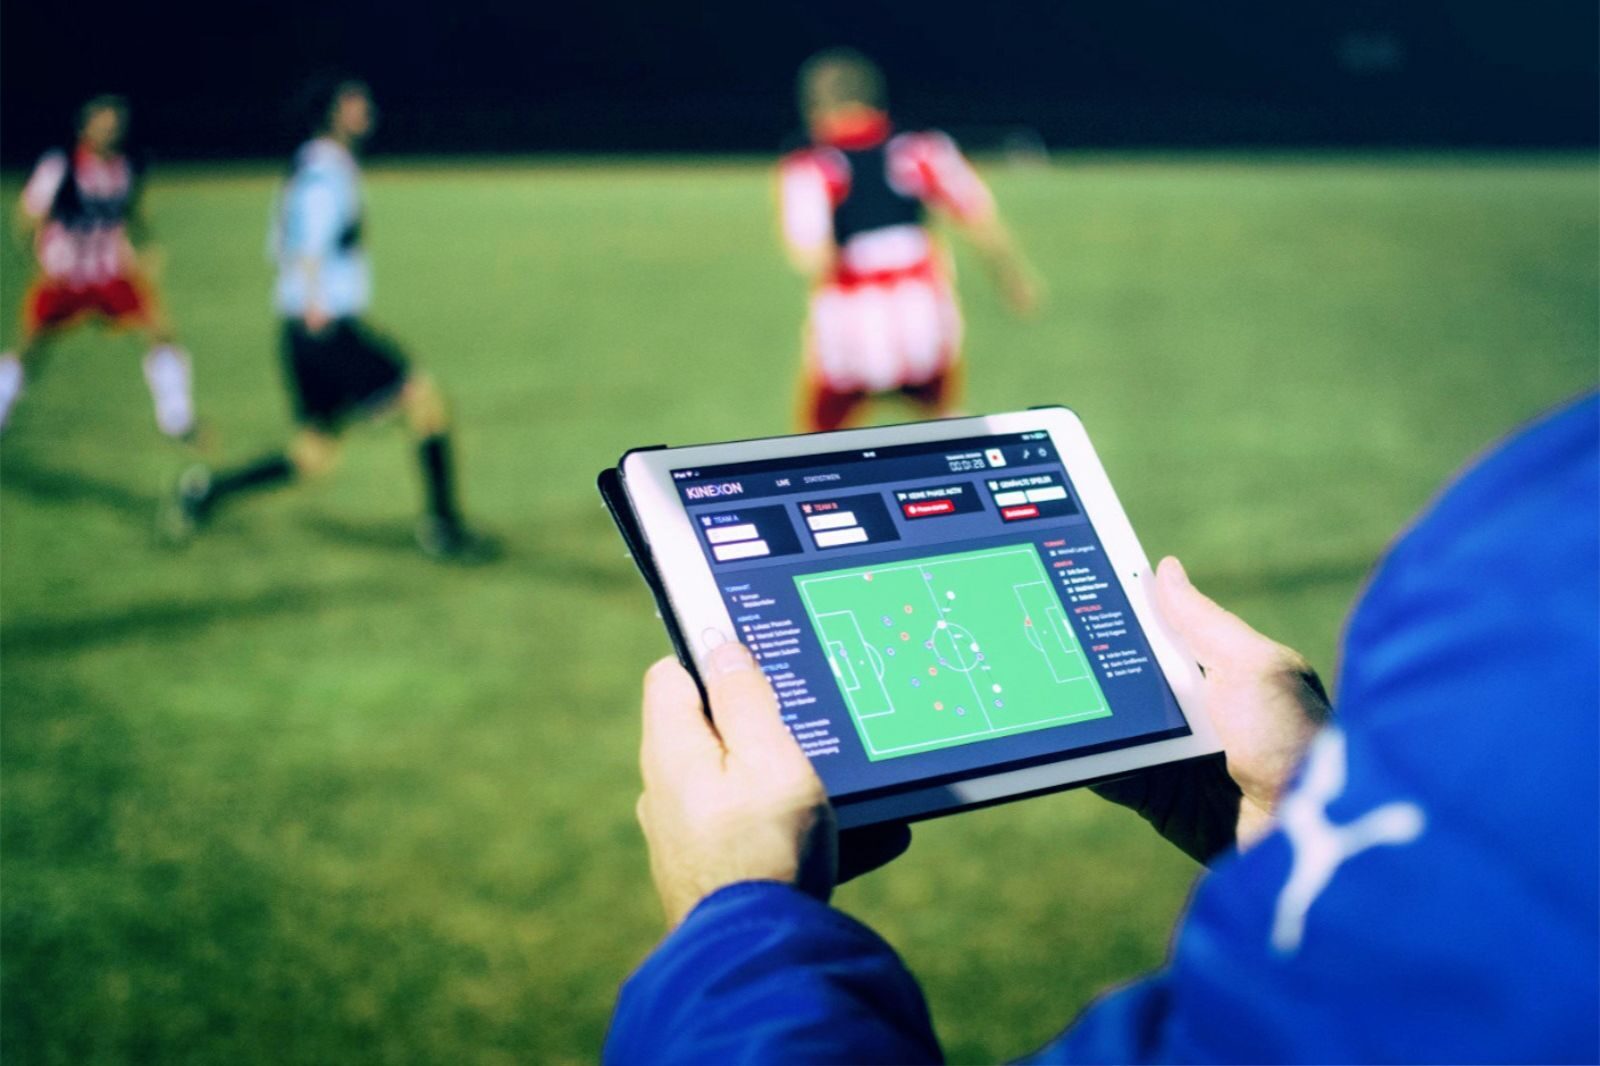
When you’re monitoring player metrics, there are many factors to consider, like finding a system that provides acceptable levels of reliability and validity.
This means that your player tracking system cannot only handle your sport-specific demands, but the data it’s giving you can be easily interpreted. Your data will do you no good if relevant stakeholders can’t use it effectively for informed decision-making. You already have so much on your plate, so why make the process of tracking player metrics any harder than it needs to be?
Putting data into context matters, but there seems to be the belief that, when it comes to data analytics in sports, having more metrics available is always better. In my opinion, many of your data-driven decisions can be broken down to three key data points.
So, let’s look at the top three player metrics you can track to optimize your team’s performance and achieve your goals.
The Power of Three Player Metrics

You might wonder why you would even entertain the thought of tracking only three player metrics. If you’re just getting started with sports analytics and in particular player performance tracking, it’s a great way to break in.
Or maybe you’re already collecting tracking data on your players but looking for a more straightforward way to analyze it. Busting all of the information you can potentially gather down to three key points makes it easier on you, your athletes, and your coaches and performance staff.
As a coach, your first inclination may be to want as much information on your players as possible. But sometimes, less is more. Tracking multiple metrics on multiple players can add up quickly in any sport. And always trying to add new or more metrics can cause you to miss some things.

“By using the ‘metric trifecta’ of volume, intensity, and density coaches can build a holistic training model to quantify the acute and chronic stress of individual sessions, weeks, and months of training and competition. In my experience, the ‘metric trifecta’ helps you cover 95% of load management & day-to-day questions on how to structure your training effectively.”
The Top 3 Player Metrics to Monitor
That’s why I advise coaches in any sport — from basketball to football, soccer, volleyball, ice hockey, team handball, and many others that sticking to these three metrics may be all you need. They are…
- Volume
- Intensity
- Density
In my experience, tracking these three metrics helps you answer 95% of your load management questions. It also provides you with day-to-day insights you can use to decide how much, how hard and how often a player should practice to be ready for competition.
Adding event-based metrics can be a great addition to a well-rounded approach to tracking on-field performance, but the more metrics we add to the mix, the more complexity we face when analyzing the data. Most teams only have limited staff available to work with the collected data. Hence, it’s important to focus on the few metrics that provide the most insights to answer your question or (dis)prove your hypothesis.
And now that you know which sports data points stand out let’s talk a little bit about each one to understand better how they can help your team improve.
We’re using player tracking and demand planners to develop cycle-oriented workouts for women athletes. We’re generating women-specific player metrics that will impact women athletes around the globe.
Learn more by clicking the link below.
What Is Volume in Sports?
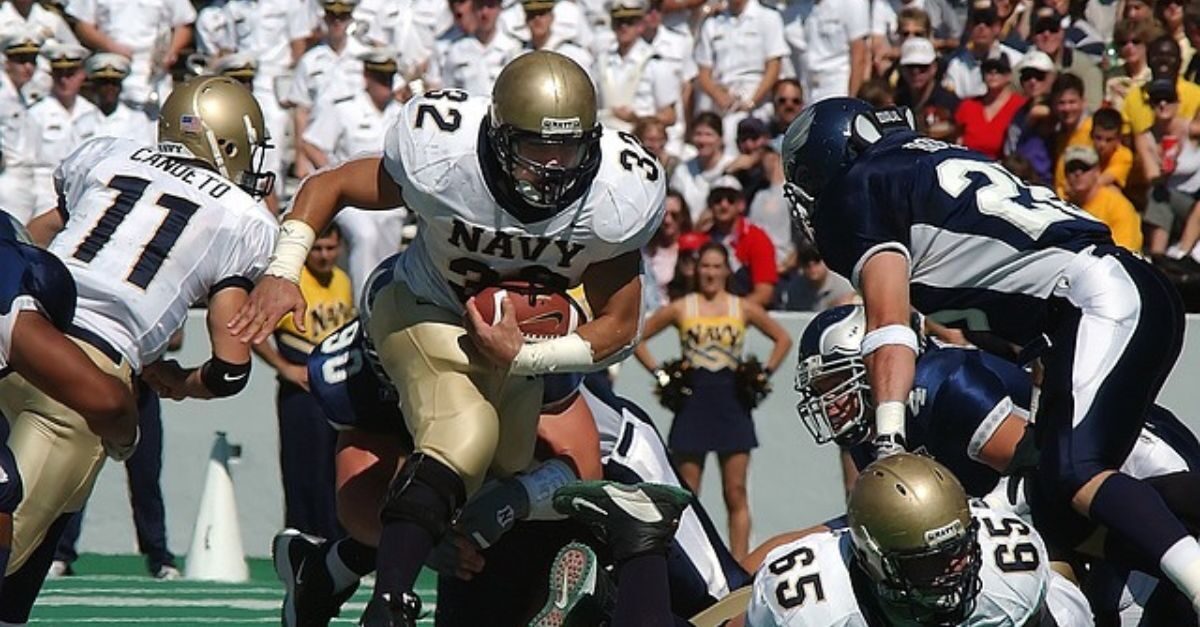
Volume describes the total amount of activity or work that is being done.
Example:
Person A runs 2 miles.
Person B runs 3 miles.
Person B runs further than Person A and has, therefore, a higher overall session load/volume.
The volume or total amount of work during a training session or game can be measured by using various metrics, including:
- Time
- Distance
- Arbitrary Load Metrics
- Accumulated Acceleration Load – based on a 3‑dimensional acceleration pattern, derived from an inertial measurement unit (IMU)
- Physio Load – a combination of distance, speed and body weight
- Mechanical Load – a combination of acceleration and deceleration events
- Jump Load – based on a 1‑dimensional (z) acceleration pattern
These are just a few examples of performance metrics you can use, but you can customize your player tracking system to fit your needs.
What is Intensity?
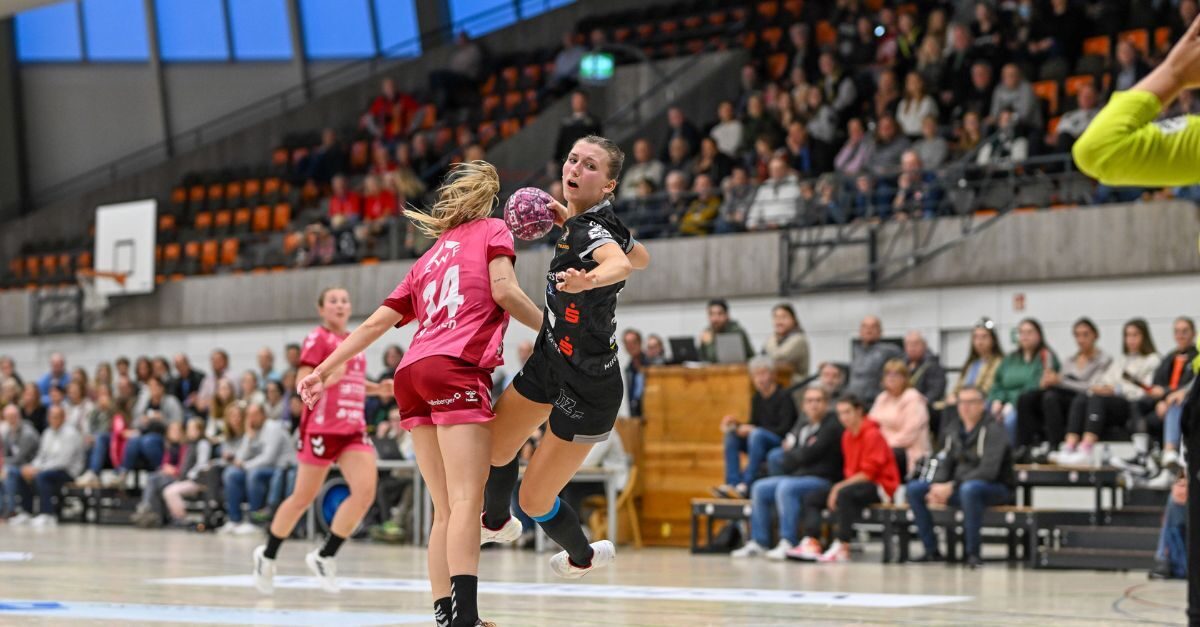
Intensity can be described as the rate of work during practice or a game. Intensity refers to how much work you can do in a given time.
Example:
Person A runs 2 miles in 60 minutes (2 mph).
Person B runs 2 miles in 30 minutes (4 mph).
Person A & B run the same distance and therefore have the same volume. However, Person B runs the same distance in less time and, thus, performs at a higher rate of work/intensity.
The intensity or rate of work during a training session or game can be measured by using various metrics, including:
- Distance per minute
- Accumulated Acceleration Load per minute
- Physio Load per minute (Physio Intensity)
- Mechanical Load per minute (Mechanical Intensity)
- Jump Load per minute
Now, let’s look at density.
What Is Density?

Density can be described as the frequency of repetitions your athletes perform within a specific time frame. Simply, it’s the amount of high-end work an athlete does during practice or a game.
Example:
Person A runs at a steady pace with an average of 10 mph.
Person B runs at alternating speeds and varies between sprinting & walking with an average of 10 mph.
Person A & B run the same distance in the same amount of time. Hence, they have the same average speed. Therefore, both perform at the same volume and intensity.
However, Person B alternates between sprinting & walking, which increases their exposure to very high-intensity activity and efforts.
The density or amount of high-end work during a training session or game can be measured by using various metrics, including:
- High-Speed Distance (Distance covered over a certain speed threshold)
- Sprints (runs over a certain speed threshold)
- Jumps (vertical displacement over certain height thresholds)
- Exertions (high-intensity activity over a certain acceleration load threshold)
Make Sports Analytics a Part of Your Game
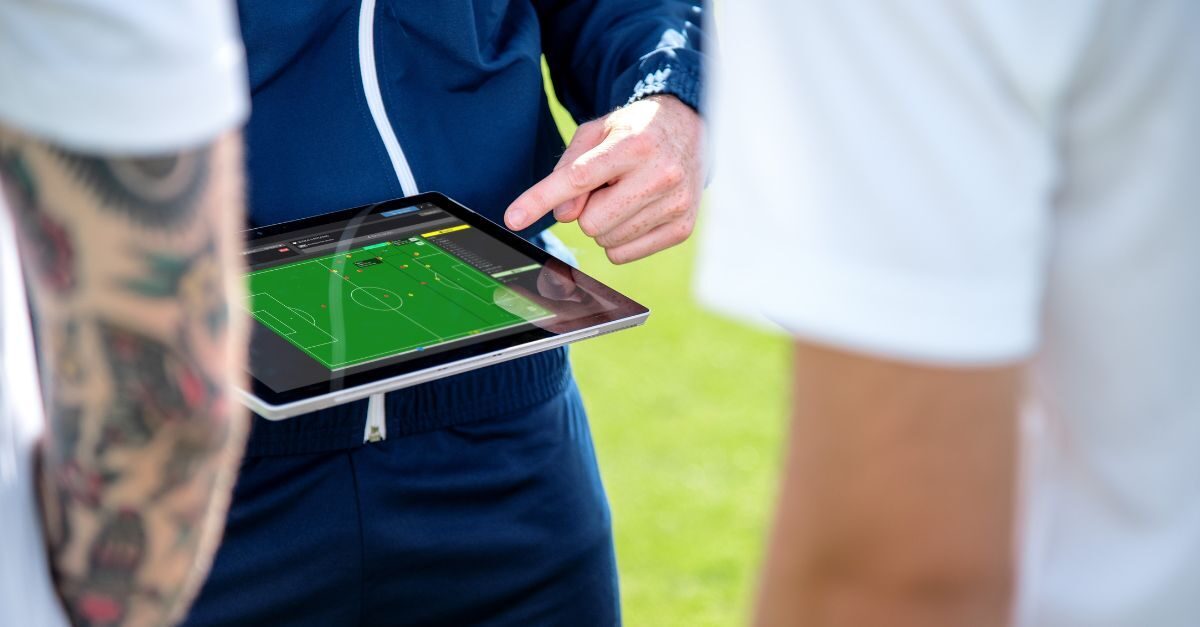
As sports continue to evolve, sports data analysis will continue to grow into an integral part of talent identification, long-term athletic development, and coaching strategies. By tracking and analyzing these three key metrics, you can make informed decisions, optimize player performance, potentially minimize injury risk, increase player availability, and collectively improve your team’s chances of success.
In the era of sports analytics, coaches who embrace data-driven approaches and understand the significance of these metrics have a distinct advantage. By leveraging the power of data, coaches can unlock their team’s full potential and achieve their goals on the field or court.
At KINEXON, we’re a sports analytics company that provides player tracking systems for any sport. We also help to teach athletes, coaches, and performance & medical staff how to use the equipment and determine which metrics should be the ones they’re tracking. In fact, education is a big part of what we do.
If you’d like to learn more about sports analytics and the insights it provides, contact us at any time. You can also download our free guide on a player tracking in basketball, but the information can be applied to almost any sport. Or check out our product brochure to find a system that’s right for you.
Want to learn more about KINEXON’s tracking solutions?
More stories

REWE Final4 Breaks New Ground with Cutting-Edge Handball
Each year, thousands of handball fans converge at the REWE Final4, while millions tune in from home. Alongside the Handball Bundesliga, it doesn’t get much bigger than this. Except this year.

Study Reveals: Olympic-Based Strength Training Enhances Handball Skills!
Imagine the power and agility of an Olympic athlete combined with the strength and endurance of a handball player. That’s exactly what a recent study set out to explore. The goal? To unlock new levels of performance for women handball players.

What's Still Missing on The Journey to Equality for Women Athletes?
Researchers from the Bundesliga club, TSG 1899 Hoffenheim, are conducting a study on the influence of the menstrual cycle on the performance of women athletes. Dr. Sascha Härtel and Dr. Ludwig Ruf shared insights into the research, and talked about what is still needed.
Study Reveals the Most Popular Shot EuroLeague Basketball Players Take
Sports analytics and data-driven forecasting play crucial roles in European basketball. Researchers are trying to identify essential performance metrics and effective coaching strategies. What they’re finding is that one type of shot is more popular than the rest.

Why Underloaded EuroLeague Basketball Players Still Need Data
As Head of Performance at Fenerbahce Beko Istanbul, Kostas Chatzichristos knows basketball analytics. He explains why coaches need to collect data on all players — even the ones who aren’t getting minutes.

What a UL Experiment Revealed About Merging Live GPS Data and Recovery Tech
In football, recovery is as important as training. Recently, the sports medicine staff from the University of Louisiana conducted an experiment to gauge the impact Firefly Recovery Devices may have on a player’s recovery with the help of live data from KINEXON Sports.
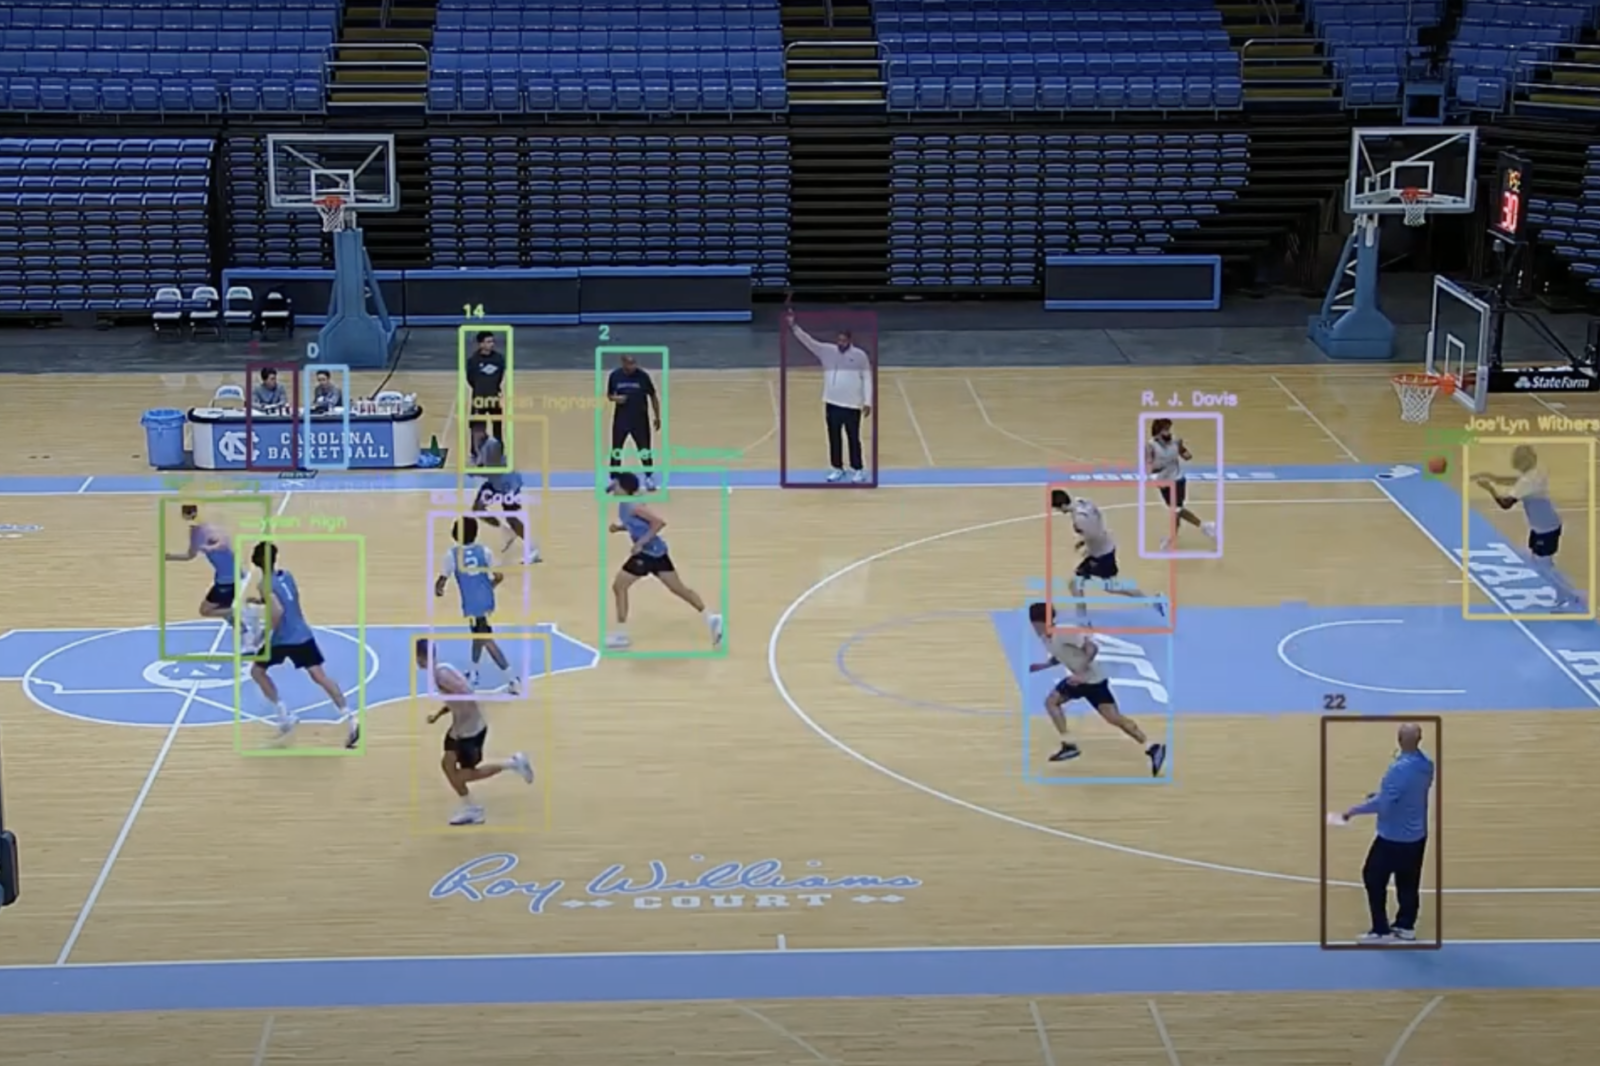
How Basketball Coaches Can Use Sports Video Analysis Software
Basketball coaches and players strive to understand the intricacies of each shot. But using a video analysis software, that doubles as basketball shot tracking app, promises to be the Holy Grail for those seeking comprehensive insights.
What Are The Volleyball Metrics That Matter Most to Coaches?
Volleyball positions require speed, agility, power, and precision. But how do you know if your team is performing at its best? How do you measure your progress and identify your strengths and weaknesses? This is where player metrics and analytics come in.
Why Evansville University’s Sports Performance Coach Dislikes Backpedaling
How can players optimize their performance and avoid wasting steps on the court? That’s the question Jeremy Portillo, the sports performance coach for Evansville University men’s basketball team, was asked on a recent episode of “The Extra Edge” podcast. He gave a jaw-dropping answer.

Athletic Performance: Why is it Important to Understand and Track Acceleration?
Athletic ability is often associated with an athlete’s explosive speed and acceleration. That’s why acceleration is often called one of the cornerstones of excellence in athletic performance. But did you know that it can be improved with the right tools and training methods?

How UAB's Strength Coach Sold Football Analytics to His Head Coach
Author: Dave Grendzynski
Lyle Henley, the Director of Sport Performance for the University of Alabama Birmingham. football team. He’s a strong advocate for sports data. He shares his story of how he sold his old school head coach, Trent Dilfer, on the idea of using data.

What Kind of Live Data Can an LPS System Provide Fans During an American Football Game?
Coaches, players, media, and fans crave real-time insights to enhance performance, strategy, and engagement in American Football. Now, LPS technology is providing just that. Giving everyone in the stands, and watching at home, a view of the game they have never seen before.
What Stanford's Volleyball Strength Coach Avoids Every Season to Stay on Top
Author: Dave Grendzynski
Tyler Friedrich is the sports performance coach for the women’s volleyball team at Stanford University. He’s been helping them improve their strength, speed, agility, endurance, and jump height for more than 8 years. He says to stay on top, there’s one thing coaches should avoid.
Why Integrating Football Match Data with Sports Performance Training is So Important
In football (or soccer, as it’s known in some parts of the world), coaches are constantly seeking innovative ways to enhance player performance. One powerful approach that’s gaining traction is the integration of match data with sports performance training metrics that are GPS-based.
What Strategies Can Coaches Use To Find Top-Tier Sports Data Analysts?
Author: Dave Grendzynski
As the Director of Sports Performance at the University of Colorado, Steve Englehart realized he needed someone who could make sense of the data he was collecting. He explains how he found his analyst and how other coaches can find one too.